Crystal Market Size | 2026–2035
The Critical First Step: Define “Crystal”
Every number below is technically “correct” — and they vary by 10x–100x because each research house defines the word crystaldifferently. Here’s the honest breakdown before a single dollar figure appears:
| Definition Scope | What’s Included | Typical 2026 Market Size | 2035 Projection | CAGR |
|---|---|---|---|---|
| ① Broad Gemstone & Precious Stone Market (jewelry + investment + decorative + industrial diamonds) | Diamonds (natural & lab), emerald/ruby/sapphire, all colored stones, semi-precious minerals | ~$38.1 Billion | ~$59.5–60.4 Billion | 5.1–6.7% |
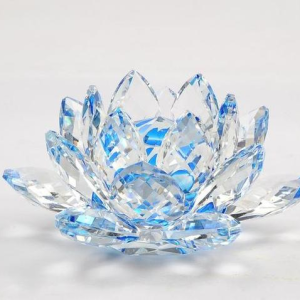
| ② Crystal Products / Decorative Crystalware (Swarovski, Baccarat, Waterford — lead crystal, lighting, tableware, decor) | Lead crystal glass, optical crystal decor, chandeliers, luxury tabletop | ~$6.1 Billion | ~$8.5 Billion | ~3.6–3.9% |
| ③ Natural + Synthetic Industrial Crystals (quartz oscillators, piezoelectric, semiconductor substrates, optics) | Quartz crystal units, synthetic sapphire, silicon wafers, laser crystals | ~$4.9–5.0 Billion (oscillator component segment alone) | ~$6.9–9.9 Billion | 3.9–8.6% |
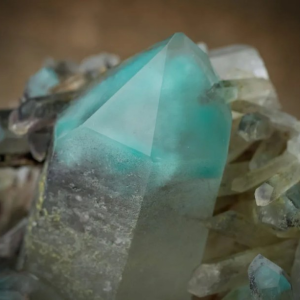
| ④ Healing / Wellness Crystal Niche (tumbles, towers, clusters, crystal-infused products sold on metaphysical claims) | Amethyst cathedrals, tumble packs, chakra kits, crystal jewelry sold in wellness context | **~0.13Billion∗∗(130M) | ~$0.33–0.35 Billion | ~11.15% |
The takeaway: If someone tells you “the crystal market is a 5Bindustry”or”a38B industry,” they’re bothright — they’re just measuring different universes.
① Broad Gemstone Market (The 38B–60B Engine)
Source: Business Research Insights / CoherentMI / Fact.MR / industry consensus
| Metric | Figure |
|---|---|
| 2026 Market Size | $38.09 Billion |
| 2035 Projection | $59.50–60.42 Billion |
| CAGR (2026–2035) | 5.08–6.7% |
Segment Breakdown (by share of demand)
- Colored Gemstones ~58% of unit demand (emeralds, sapphires, rubies leading; emerald alone ~25.7% segment share by some measures)
- Diamonds (natural + lab-grown) ~40–45% — natural <2ct facing softness, lab-grown capturing volume at compressed prices
- Jewelry & Ornaments = 67–73% of total application share
Regional Leadership
| Region | Share |
|---|---|
| Asia-Pacific | ~42–47% (China + India = production + consumption juggernauts) |
| North America | ~18% (largest consumer premium market; ~62% of raw imports from Brazil/China) |
| Europe | ~26% (luxury branding, cutting heritage) |
The Colored Gemstone Sub-Segment (Fastest Premium Growth)
MarkWide Research pegs the Colored Gemstones standalone market at 18.7B(2026)→38.65B (2035) at an 8.4% CAGR — driven by the shift away from diamond-centric portfolios toward ruby/sapphire/emerald as alternative stores of value and the bridal pivot to unique colored stones.
② Crystal Products Market (Decorative / Tabletop / Architectural — The “Swarovski” Lane)
Source: Fundamental Business Insights / IndexBox
| Metric | Figure |
|---|---|
| 2025 Base | ~$5.94 Billion |
| 2026 Market Size | ~$6.12 Billion |
| 2035 Projection | ~$8.46 Billion |
| CAGR (2026–2035) | ~3.6% |
Key dynamics:
- Europe holds ~43.78% revenue share (heritage brands: Baccarat, Lalique, Waterford, Swarovski/Austria, Preciosa/Czech Republic)
- Residential segment = 56.65% of demand (home-as-sanctuary trend feeding chandelier/decor demand)
- Growth constrained by gifting-seasonality and competition from contemporary minimal-aesthetic alternatives, but sustained by luxury interior staging and hospitality (hotels, restaurants) specifying statement crystal fixtures
③ Industrial & Electronic Crystals (Quartz Oscillators, Synthetic Substrates)
Source: BRI (electronics-focused crystal oscillator market) / MarkWide (rare/high-purity synthetic crystals)
Two different slices here:
A. Quartz Crystal Oscillators (TCXO/VCXO/SPXO/OCXO) — Electronics Component Market
| Metric | Figure |
|---|---|
| 2026 | $4.93 Billion |
| 2035 | $6.95 Billion |
| CAGR | 3.9% |
Driven by GPS, telecom (5G→6G), automotive electronics, and portable consumer devices. Every smartphone/CPU/clock circuit needs one. This is the invisible crystal economy — not “healing stones,” but the literal timing heartbeat of modern electronics.
B. Rare / High-Purity Synthetic Crystals (Semiconductor + Quantum + Photonics)
| Metric | Figure |
|---|---|
| 2026 | $4.70 Billion |
| 2035 | $9.88 Billion |
| CAGR | 8.60% |
Growth catalysts: advanced-node semiconductor substrates, EU REACH-driven process shifts, photonic qubit architectures in quantum computing needing engineered nonlinear crystals not available in nature.
④ Healing / Wellness Crystal Niche (The Viral Growth Story)
Source: Business Research Insights — Crystal Therapies Products Market
| Metric | Figure |
|---|---|
| 2026 Market Size | 0.13Billion(130 Million) |
| 2035 Projection | 0.330–0.350Billion(330–350 Million) |
| CAGR (2026–2035) | 11.15–11.46% |
Why It Punches Above Its Weight
- North America = 38% market share (US is the global engine of crystal-as-wellness-consumerism)
- Asia-Pacific = fastest adoption growth (~33% surge in uptake rates)
- Online availability surged 46% — TikTok Shop / IG / Reels algorithms are the real growth driver, not clinical validation
- Top 5 players hold only 41% — meaning the other 59% is fragmented across thousands of local mineral vendors, Instagram sellers, and mall kiosks that don’t appear in formal B2B data
- Constraint: Lack of scientific validation caps institutional adoption; ~29% of regions show regulatory resistance
Consolidated: Which Number Should You Use?
| If you’re writing about… | Cite this figure |
|---|---|
| Investment / finance / luxury goods context | Gemstone market: 38.1B→59.5B (5.1% CAGR) |
| Manufacturing / tech / supply chain | Industrial quartz + synthetics: 4.9B→9.9B (3.9–8.6% depending on slice) |
| Home luxury / hospitality / decor trade | Crystal products (tabletop/chandelier): 6.1B→8.5B (3.6% CAGR) |
| Wellness / New Age / TikTok commerce angle | Healing crystal niche: 130M→350M (11.2% CAGR) |
| “The whole thing” (all definitions rolled up loosely) | ~$45–50B effective addressable in 2026 if you combine ①+②+③ (with double-counting caveats) |
The One Chart That Explains Everything (2026 → 2035 Trajectory)
$60B ┤                                              ●  Gemstones $59.5B
$50B ┤                                      ●
$40B ┤              ● Gemstones $38.1B      /
$30B ┤             /                       ●
$20B ┤            /
$10B ┤   ● Crystal Products $6.1B    ● $8.5B     ● Industrial $6.9–9.9B
 $0B ┼─────────────────────────────────────────────
     2026                                   2035
               (Healing niche: $0.13B → $0.35B, barely visible at this scale!)
The healing crystal niche is the fastest grower by percentage (11%+ CAGR) but starts from the smallest base. The gemstone market moves the actual billions. The industrial slice is what literally runs the world’s electronics.
⚠️ Methodology note: Market research firms (BRI, CoherentMI, MarkWide, IndexBox, Fact.MR) use different taxonomies, scope boundaries, and forecasting models — hence the ranges rather than a single definitive number. The healing-crystal segment figures in particular come from reports that categorize by color(purple/indigo/blue…) rather than mineralogy, which tells you everything about how loosely defined this category still is. Always state your scope definition upfront when citing any of these numbers.
Leave a Reply
Want to join the discussion?Feel free to contribute!